
If you're new to last mile delivery, welcome to the party. This club is filled with long days, complicated logistics and razor thin margins. But, when done right, a well run delivery operation can also be filled with delighted customers that come back to your business time and time again.
Here at Onfleet, we talk about delivery a lot—especially the cost of doing delivery. It's generally understood that last mile costs account for about 40-50% of the entire supply chain. While the likes of your favorite restaurant or grocery delivery apps have convinced consumers that delivery costs $6.99, that just does not reflect the reality of how much local delivery will cost your company. According to this author (thoughts and opinions are my own), the sweet spot for a local last mile delivery is $10—let the debate commence! Of course, economies of scale can allow a company to drive that $10 price tag down; however, this is a good target for a new delivery operation.
Whether higher or lower, let's use that $10 ballpark figure to get a sense of where the true costs lie when it comes to last mile delivery.
Labor (60%)
Of all of the delivery companies hiring through Onfleet's public job board, a rough average of their posted hourly rate is about $18 per hour. While difficult to normalize across industries, a properly optimized route should aim to deliver about three deliveries per hour. On-demand might be closer to two deliveries per hour, but probably includes some sort of tip structure.
Hence forth, back of the napkin math for labor costs per $10 delivery comes out to $6 or 60%.
Fuel (10%)
For this piece, we analyzed over 25,000 actual grocery orders delivered to happy customers in the great state of Wisconsin. While some might associate last mile delivery with urban dwellings, customers living in the suburbs are demanding delivery more than ever! Of those 25,000 deliveries, the average distance driven was 9.6052 miles.
Again with our speciality, back of the napkin math, at roughly $2 per gallon of gas and about 20 miles driven per gallon, the cost for fuel per $10 delivery is roughly $1 or 10%.
In case you were wondering, the top five items ordered by those customers: milk (8.2%), eggs (5.4%), cucumbers (4.3%), strawberries (4.1%) and avocados (3.2%). Average basket size was $164.92 or 15.6 bags!
Packaging / delivery equipment (10%)
To ensure a safe journey from store to customer door, specialized packaging will be required. Again, this is difficult to normalize across industries, but this delivery specific packaging could include coolers, pizza sleeves, drink holders, freeze dried ice, crates, dollies, hand carts, straps or anything else you can think a professionally equipped driver might need.
In this interesting piece (highly recommend) by restauranteur Joelle Parenteau about delivery, she accounts for $.35 per meal for packaging alone. As her restaurant specializes in relatively portable döner, this is probably on the low end for most delivery businesses. Those gel packs you see in your Blue Apron box cost a whopping $.27 when purchased in bulk. One of those Domino's Pizza Warmers can run upwards of $50—granted that's a one-time expense.
Regardless of the industry, delivery will require specialized packaging. Our back of the napkin math comes to $1 per delivery or 10%.
Software (10%)
The days of the clipboard carrying delivery driver are over. Today's sophisticated delivery operations need to utilize a plethora of integrated tools to keep track of the chaos. These could include tools for: payroll, delivery management software (👋), internal communications, applicant tracking, background checks, gas cards, etc.
Back of the napkin math on this is about $1 per delivery or 10% of the cost.
Miscellaneous (10%)
We're reserving a 10% buffer for the ever-convenient "miscellaneous" category. This could include industry specific elements that are going to need consideration for some businesses. Think warehouses, dispatching, sorting, specialized vehicles, etc.
Delivery is also full of the unexpected. This category also includes the unexpected tow truck expense, the unexpected overtime pay due to call outs, the unexpected refund due to a tardy delivery route. This is delivery... things are going to happen.
This backboard category is where savvy operators make or break their business. Allowing the unexpected expenses to pile up is where profits begin to fly out the window. Back of the napkin math for miscellaneous expenses: $1 or 10%.
When it comes to delivery, controlling fixed costs is paramount. As driver payroll is the largest of those fixed costs, driver utilization can be the trickiest element to get right. Delivery operators constantly deal with the chicken and egg conundrum when it comes to capacity. Hire too many drivers and your payroll will go through the roof, but deliveries will be on time. Under staff and your per delivery costs will become cheaper, but your drivers will have routes they might not be able to handle.
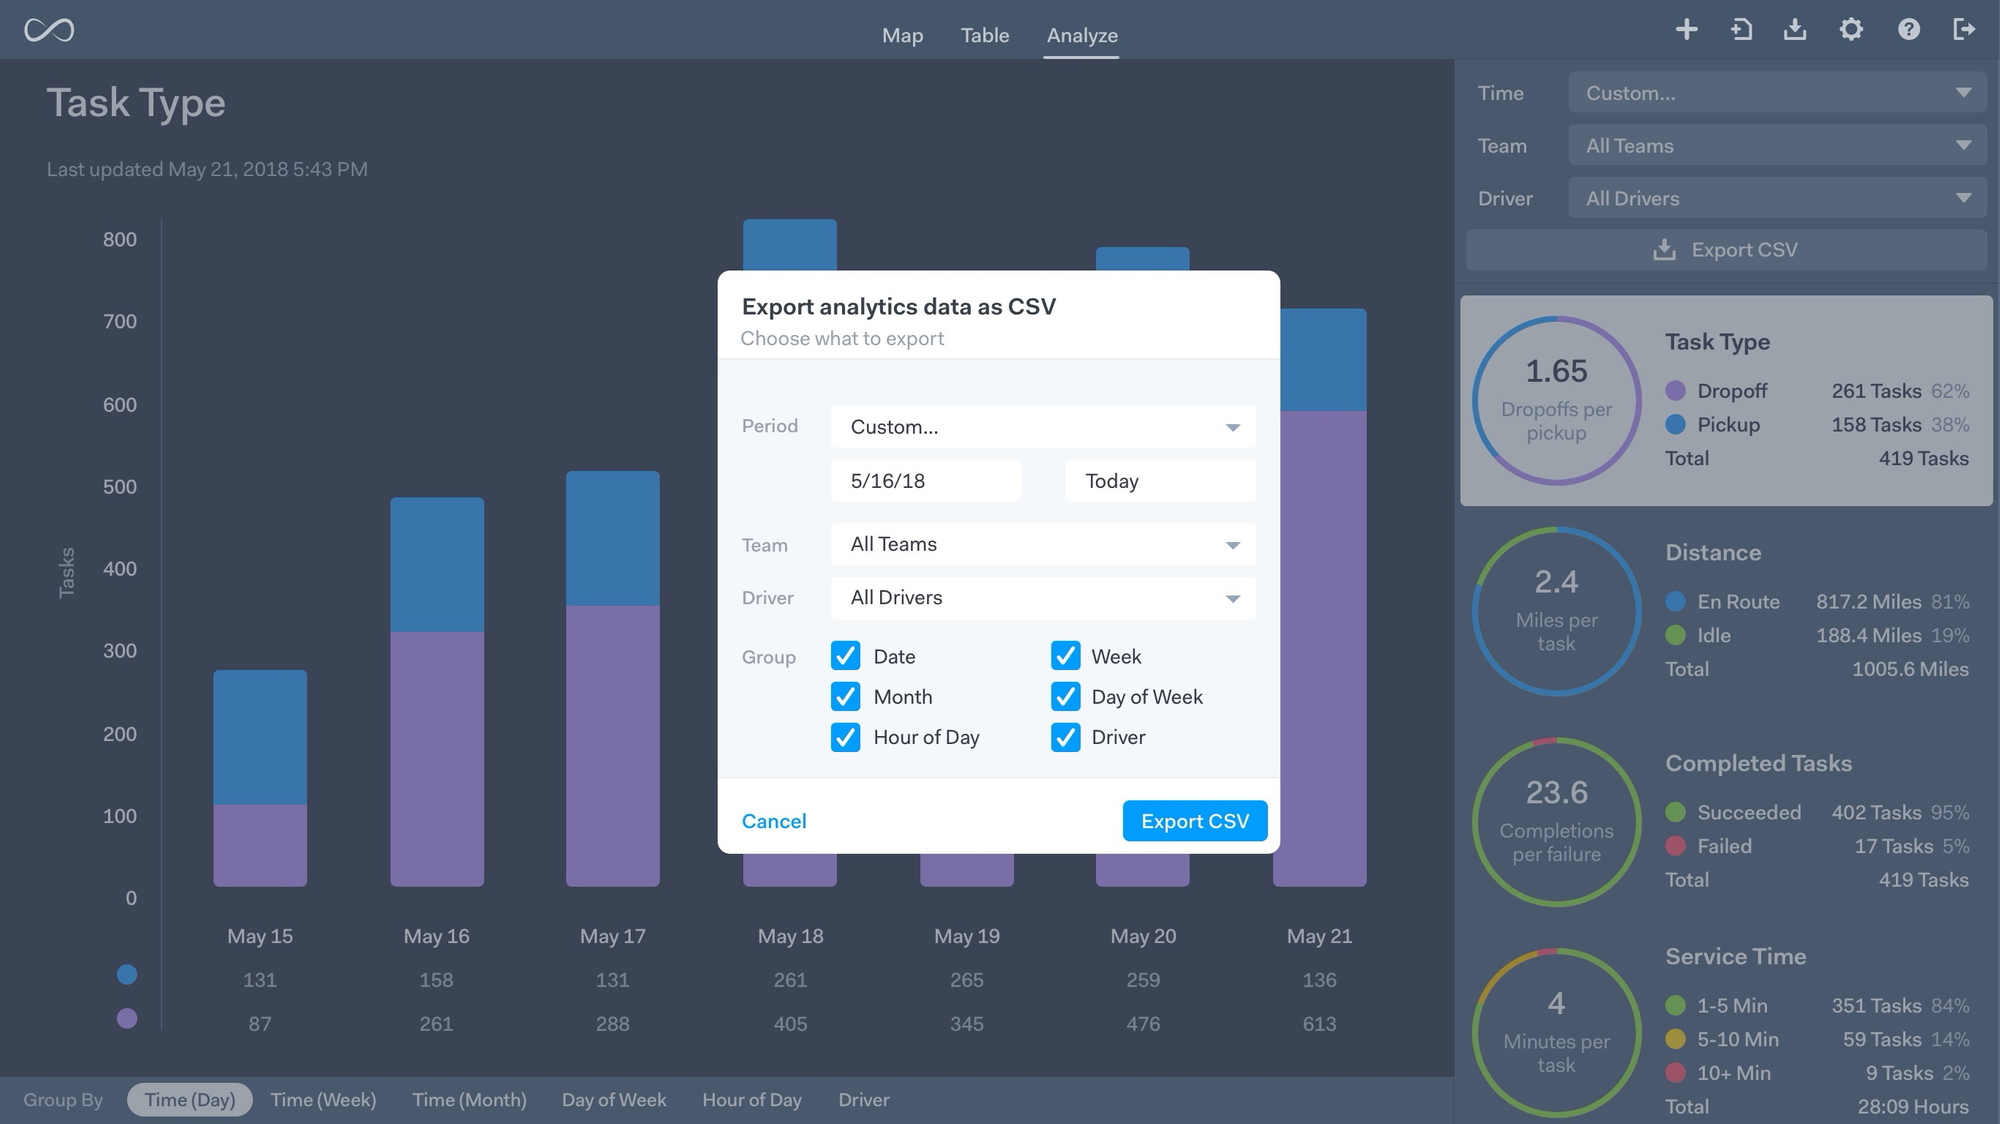
Having the right tools can help with this balancing act. Onfleet offers sophisticated out-of-the-box features that allow even a small delivery operation to introduce advanced management techniques. Our powerful route optimization engine will help with the aforementioned driver utilization. Utilizing analytics will help with forecasting, further controlling costs. Empowering drivers to securely communicate directly with customers will drastically reduce dispatching costs. Furthermore, providing real-time tracking and delivery estimates to those customers will further reduce support calls and increase customer satisfaction.
For more insights, see how we helped boost the delivery capacity at United Supermarkets by 50 percent without adding any trucks.
Learn more about how Onfleet can help mitigate your costs, increase efficiency, and deliver happier customers!