
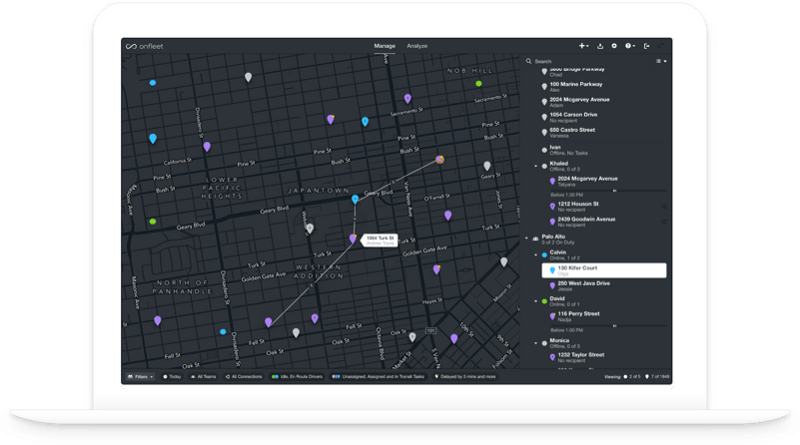
Dispatchers of delivery operations of any size can use Onfleet’s powerful web-based dashboard to receive real-time updates as deliveries are occurring throughout the day. Some of the most useful information available within the dashboard include up to the second driver location, delivery status, proof of delivery assets, as well as driver routes throughout the duration of a delivery.
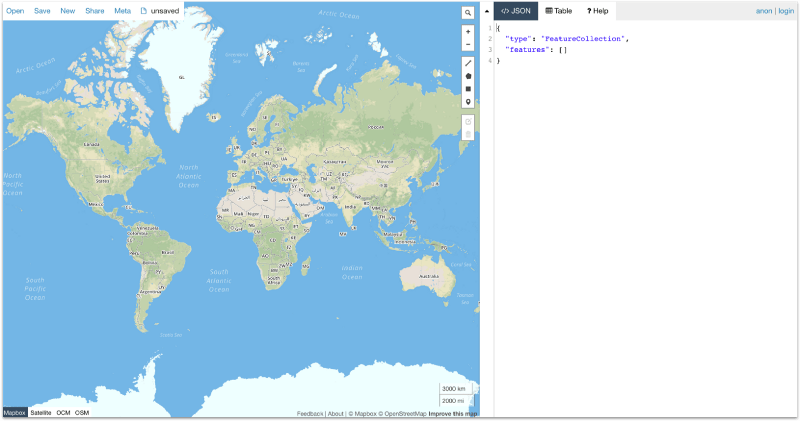
One feature that can be utilized to visually customize the dashboard is applying a map overlay in the form of a GeoJSON. For a little background, a GeoJSON is defined as:
GeoJSON: an open standard format designed for representing simple geographical features, along with their non-spatial attributes.
In the context of Onfleet, this is simply a customized addition to the dashboard map that allows dispatchers to create different sections or areas of interest. This feature can be utilized in a number of ways, including creating a visualization of delivery routes, neighborhoods, rate ranges or any other categories that reflect the operations of a particular company.
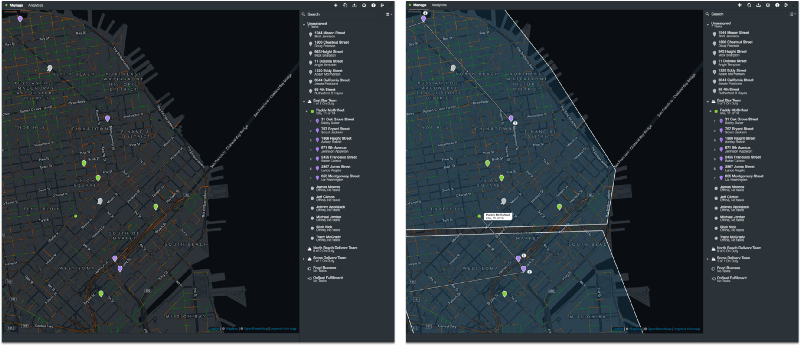
Take a look at an example of an Onfleet dispatcher’s view without a map overlay (on the left) and with a map overlay (on the right).
Adding a Map Overlay to Onfleet Dashboard
Adding an overlay can be done in two simple steps:
- The easiest way to create a GeoJSON map overlay is to utilize the free tool http://geojson.io/. Simply create polygons that reflect the neighborhoods or services areas within your operations. Then save as a GeoJSON file.
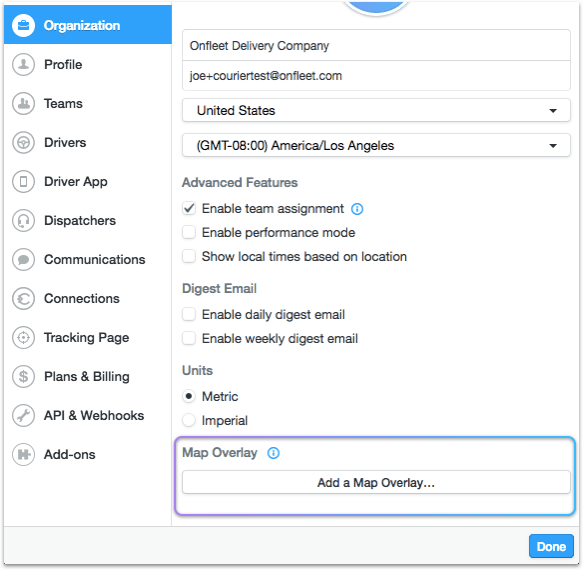
2. Then simply open the Organization tab within the settings of your Onfleet dashboard, scroll to the bottom and click Add a Map Overlay… Find and select the GeoJSON file that was saved in the previous step. Once selected, the map overlay should be visible immediately within your dashboard.
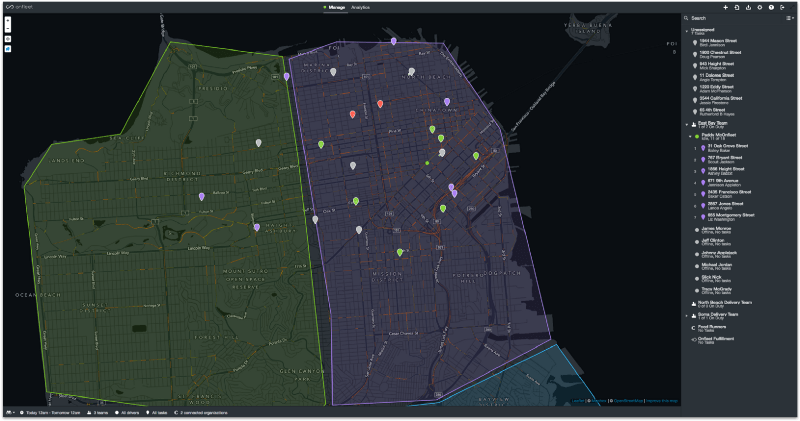
Adding a Map Overlay with Color
Another interesting way to customize the map overlay feature is with the use of color. You can see an example of using colored map overlays below:
This can be achieved with the same http://geojson.io/ tool mentioned above, with one more step.
- Create the another GeoJSON map with features that reflects your operations.
- In the body of the JavaScript file on the right side of the builder, simply add the following tag (in bold below) with any color code to the properties field:
If you have any questions about this process, please feel free to reach out to sales@onfleet.com and we’d be happy to help!